Installation
Vizalyze is a desktop application. Load, chart, compare, process, and report on measurement data in the installed app on your machine. The site at vizalyze.app provides downloads, documentation, billing, and a few web-only extras (shared report links, account dashboard, live monitor) - it is not a browser-based replacement for the desktop app.
What runs where
- Desktop app - everything in this guide: import, charts, signal processing, Axy AI chat, CAN decode, batch reports, data lineage
- Website - download installers (sign in required), manage subscription, optional encrypted cloud sync, open shared report links in a browser, Pro+ live monitor dashboard
No separate Python install - dependencies are bundled with the desktop app.
First Launch
After installing, launch Vizalyze from the Start menu or desktop shortcut.
On first launch you'll see the Welcome screen with options to:
- Open an existing project folder
- Load a recent file directly
- Open one of the built-in example datasets
- Sign in for cloud sync (optional - skip to use locally)
Setting Your Working Folder
The working folder is where Vizalyze stores sessions, exports, templates, and recipes. It does not need to be the same folder as your data files - think of it as your project workspace.
Open Control Settings
Click Control Settings in the ribbon (rightmost step), or press Ctrl+,.
Set Working Folder
Click Browse… next to "Working Folder" and choose or create a folder. Vizalyze will create these subdirectories automatically:
Sessions/- saved workflow statesExports/- report output filesImport_Templates/- reusable import configsReport_Templates/-.dpttemplate filesRecipes/- pipeline JSON recipes
Save settings
Click Apply. The working folder is remembered across sessions.
Step 1 - Load Your Data
Click the Load step in the ribbon (or drag-and-drop files onto the app window).
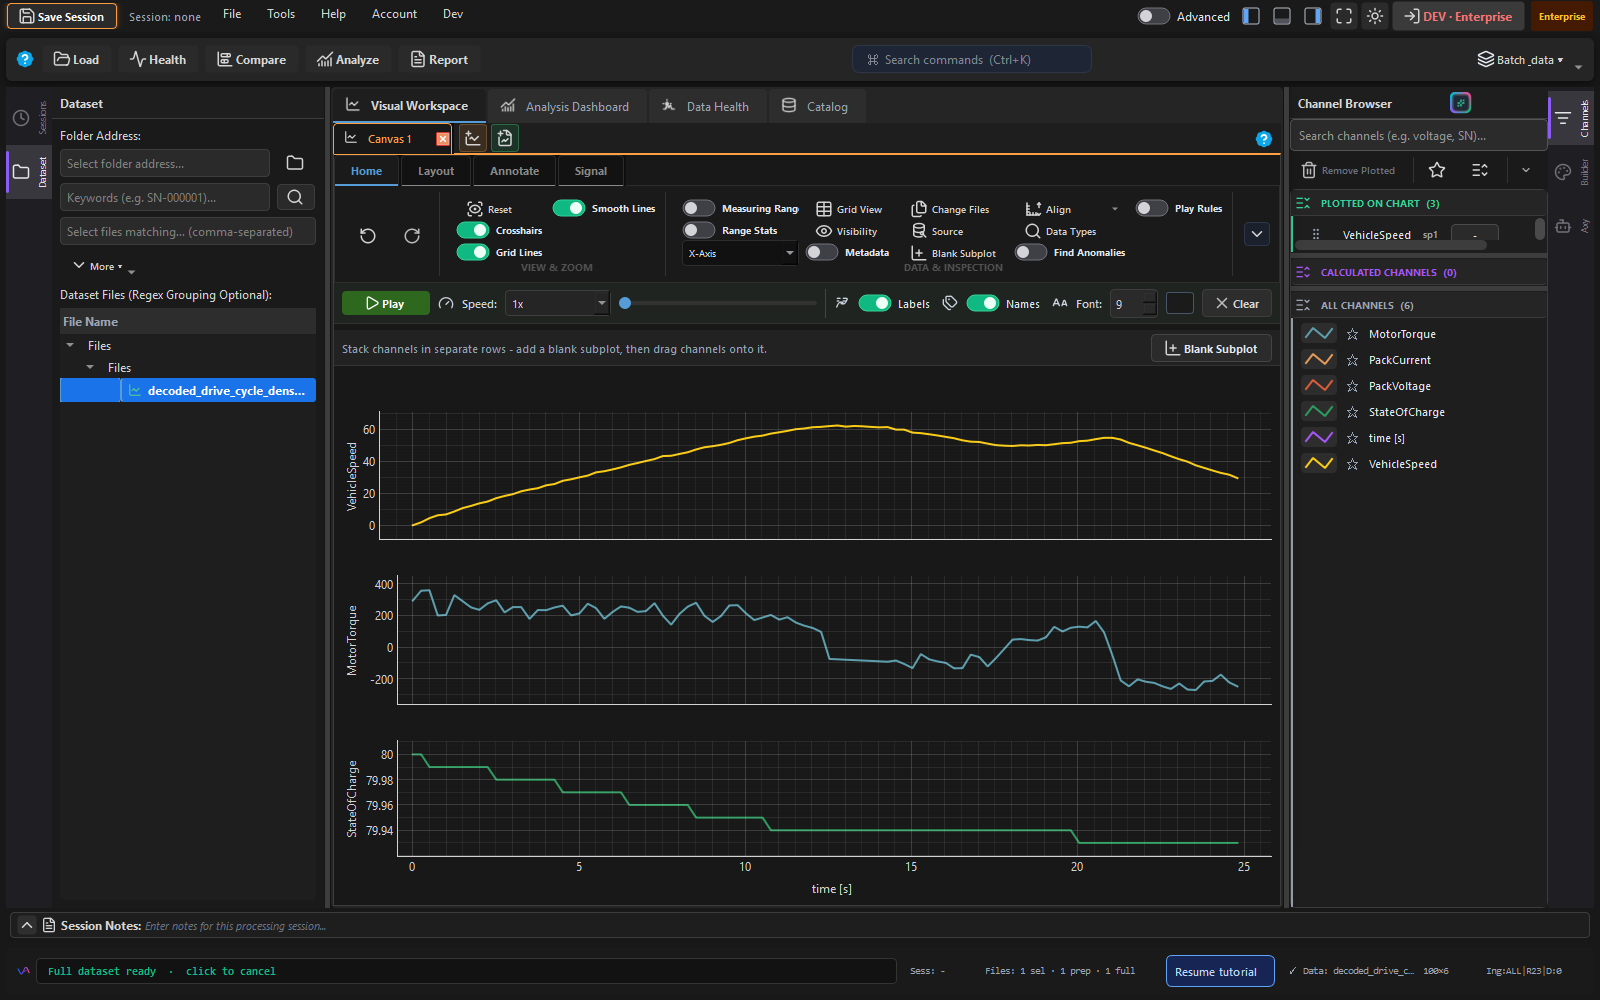
Loading a file
Drag & drop
Drag one or more files from Windows Explorer directly onto the Vizalyze window. Multiple files load into the same session.
File picker
Click Open File… (or Ctrl+O) and select your file. Supported extensions are pre-filtered.
Preview & confirm
A preview of the first 2,000 rows appears. Review column names and data types, then click Load to load the full file.
Tips
- For Excel files with multiple sheets: choose which sheet to load in the sheet picker dialog, or set the default in Control Settings → Excel Sheet Policy.
- For CSV files with header metadata (test ID, instrument name, etc.): use the Preamble settings to extract that metadata into the session automatically.
- For MDF/MF4 files: assign a CAN database first (Tools → CAN Database Manager) to decode bus signals on load.
Step 2 - Check Data Health
After loading, click Health in the ribbon. The Data Health panel runs automatically and shows a summary within seconds.
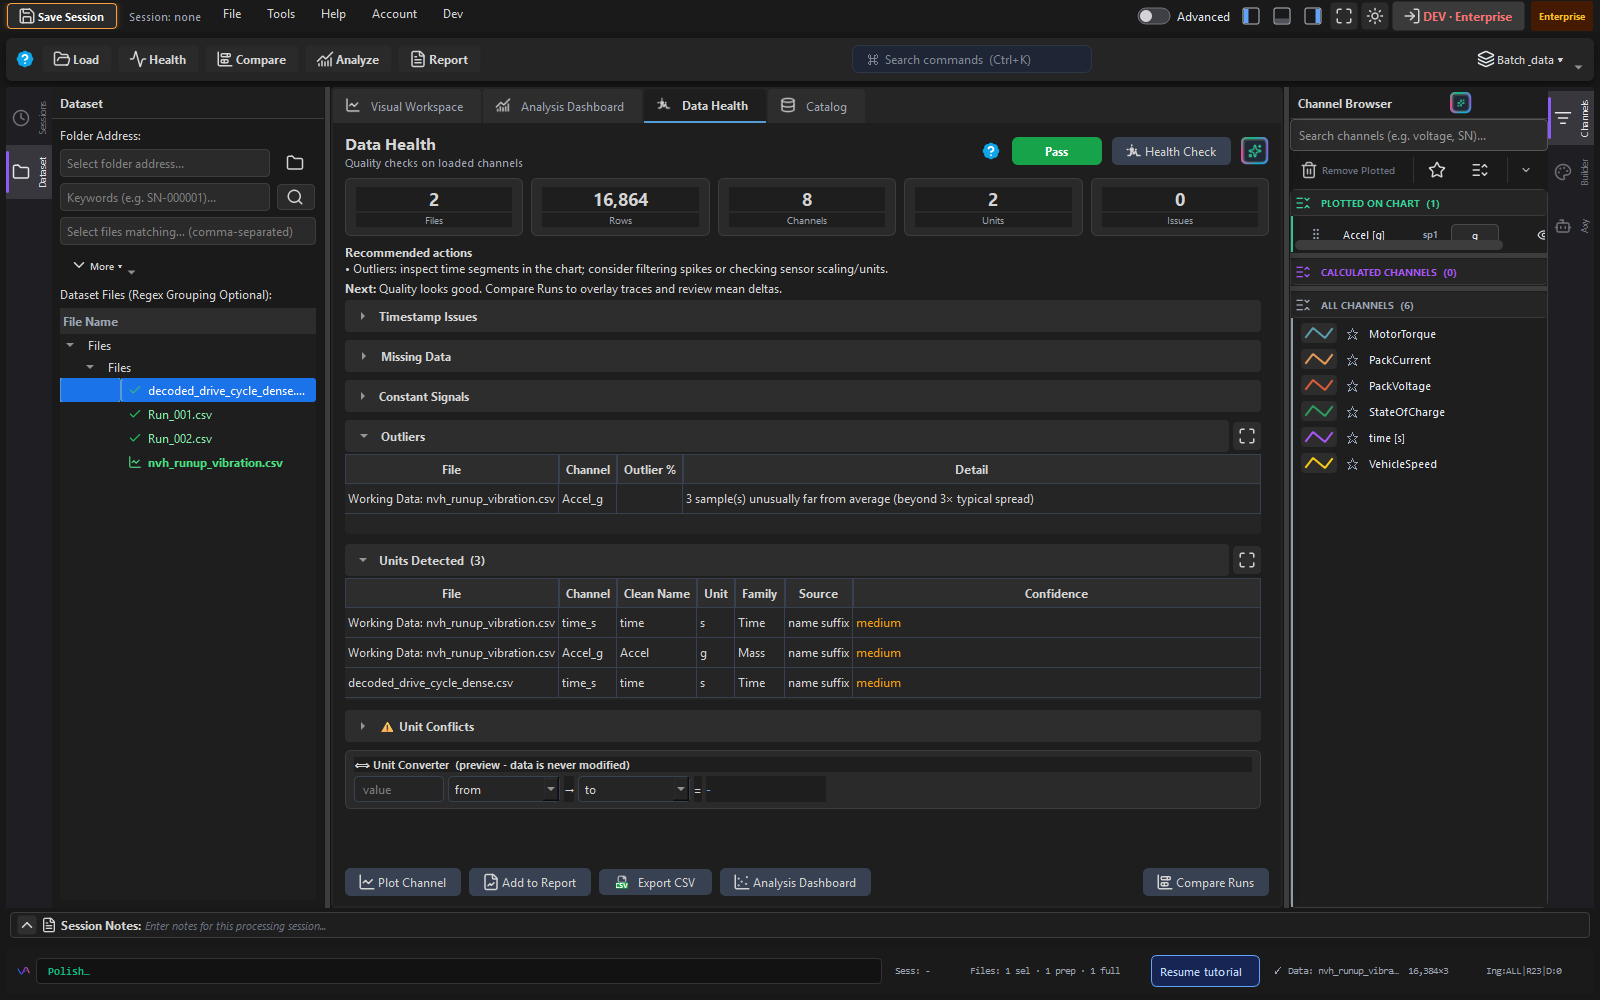
Reading the report
- ✓ Pass - channel is clean, no action needed
- ⚠ Warn - minor issues (e.g., <5% missing, occasional irregular timestamp) - review before analysis
- ✗ Fail - significant issues (constant channel, >10% missing, timestamp conflicts) - investigate before trusting results
Recommended actions
Click any badge or issue in the Health panel to see the recommended next step. Common recommendations:
- "5 channels have constant values" → check sensor connections; exclude these channels from analysis
- "Timestamp duplicates at 12 locations" → use Step alignment in Compare Runs instead of time-column alignment
- "HV_Voltage: 8.3% missing" → fill with linear interpolation in the Code Panel before statistical analysis
Step 3 - Compare Runs
Load two or more files and click Compare in the ribbon to overlay them on a single chart.
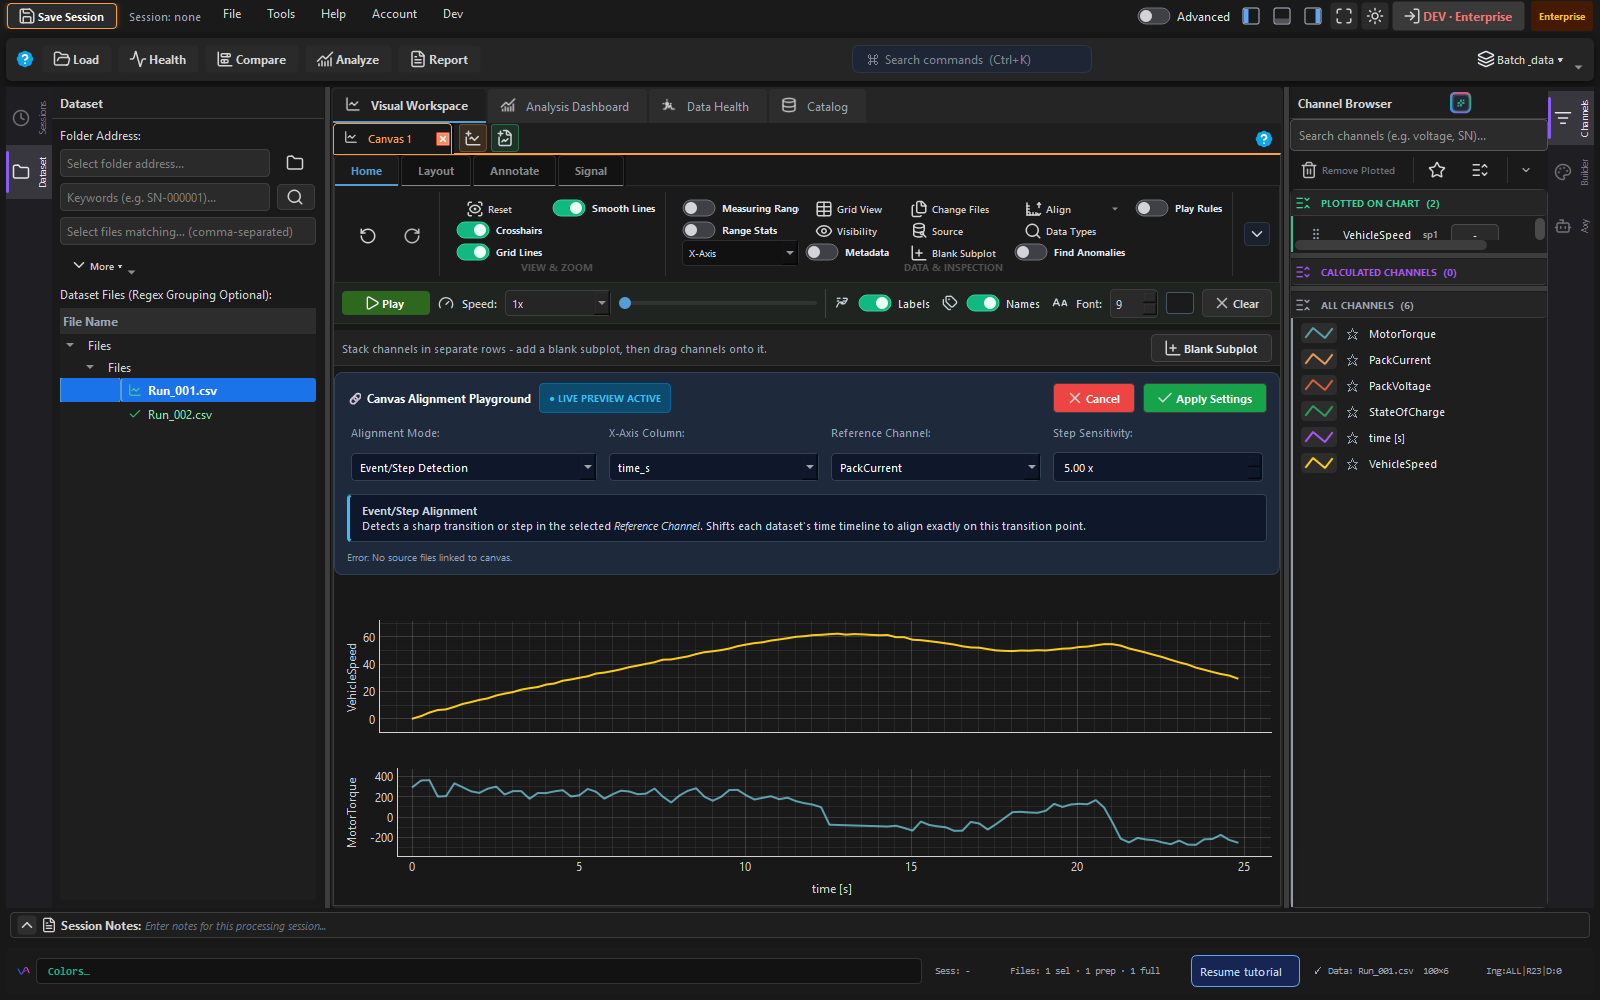
Quick comparison (3 steps)
Select runs
Check the boxes next to the files you want to compare in the left panel. At least 2 runs are needed.
Choose alignment mode
Select how the time axes should be aligned. Trend t=0 (zero at start of each run) is the best default for comparing drive cycles or test sequences of similar length.
Select channel
Pick the primary channel to compare (e.g., Vehicle_Speed). Additional channels can be overlaid from the channel browser.
Step 4 - Analyze
Click Analyze in the ribbon. Select a domain profile to get pre-loaded KPI recommendations for your use case.
Choose your domain
The domain profile selector is at the top of the Analysis panel. Options: Generic, Fuel Cell, Battery, Thermal, Vehicle, Emissions, Pharma HPLC, Pharma GC/MS.
Review statistics
The stats table shows min/max/mean/std/median/P5/P95 for every channel. Click any column header to sort. Click any cell to jump to that time in the chart.
Set limits
Click Edit Limits… to define upper and lower bounds per channel. The analysis will then show Pass/Warn/Fail badges for each channel. Limits save automatically to the current recipe.
Step 5 - Generate a Report
Click Report in the ribbon. Choose a template or preset and export to PPTX, Word, or PDF.
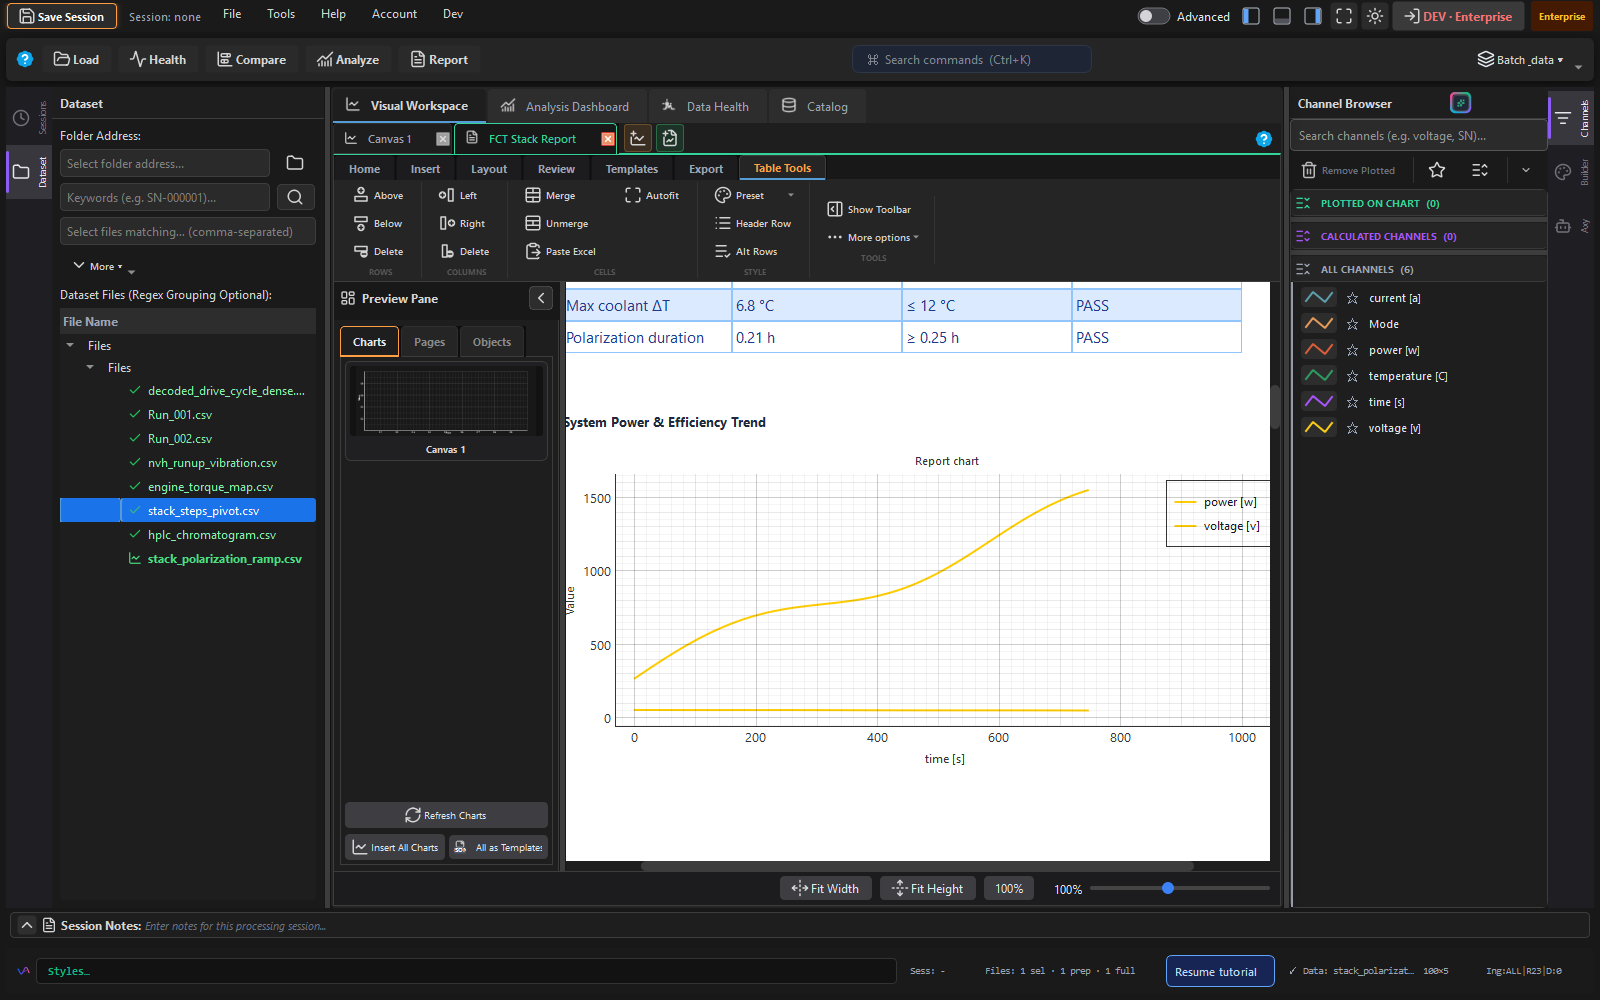
Quick report (3 steps)
Select a preset
Choose from 7 built-in presets: Durability, Run Comparison, Sensor Drift, Step Test, Limit Check, Transient, or Efficiency. Or select a custom .dpt template.
Configure output
Set the output format (PPTX / DOCX / PDF), title, author, and which datasets to include.
Export
Click Export Report. The file is saved to Exports/ in your working folder and opened automatically.
How to Decode CAN/LIN Data (MDF Files)
If your MDF/MF4 file contains raw CAN bus data, you need to assign a database (DBC, ARXML, KCD, or SYM) to decode the physical signals.
Open CAN Database Manager
Tools → Data → CAN Database Manager
Add your database
Click Add Database… and select your DBC or ARXML file. It's added to the persistent library.
Assign to your file
Select your MDF file in the left panel, then click Assign to Run_XXX.mf4. Or set it as the global default for all MDF files.
Reload the file
Right-click the file in the dataset tree → Reload. CAN signals now appear as decoded physical channels with correct units.
Creating Import Templates
Import templates save the exact parsing configuration for a file type so you don't have to configure it every time.
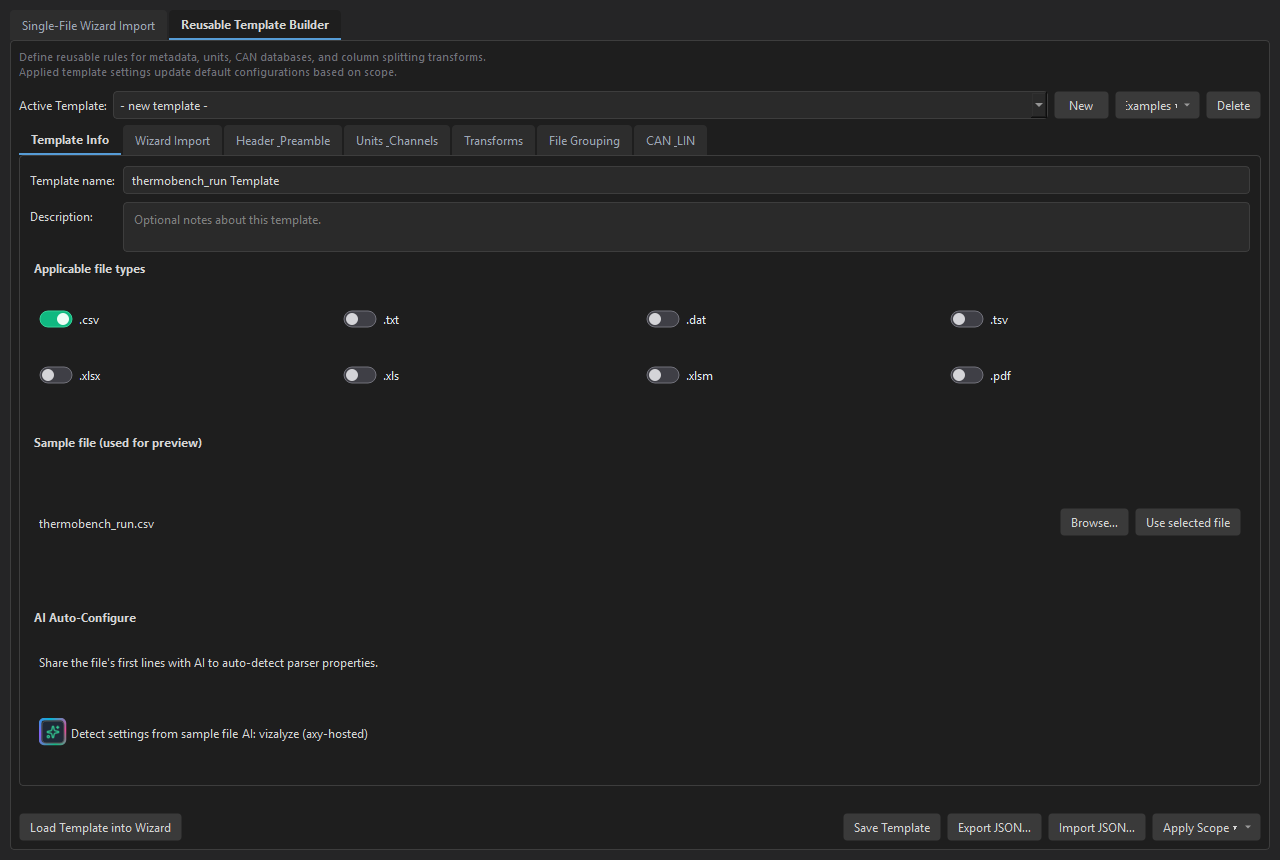
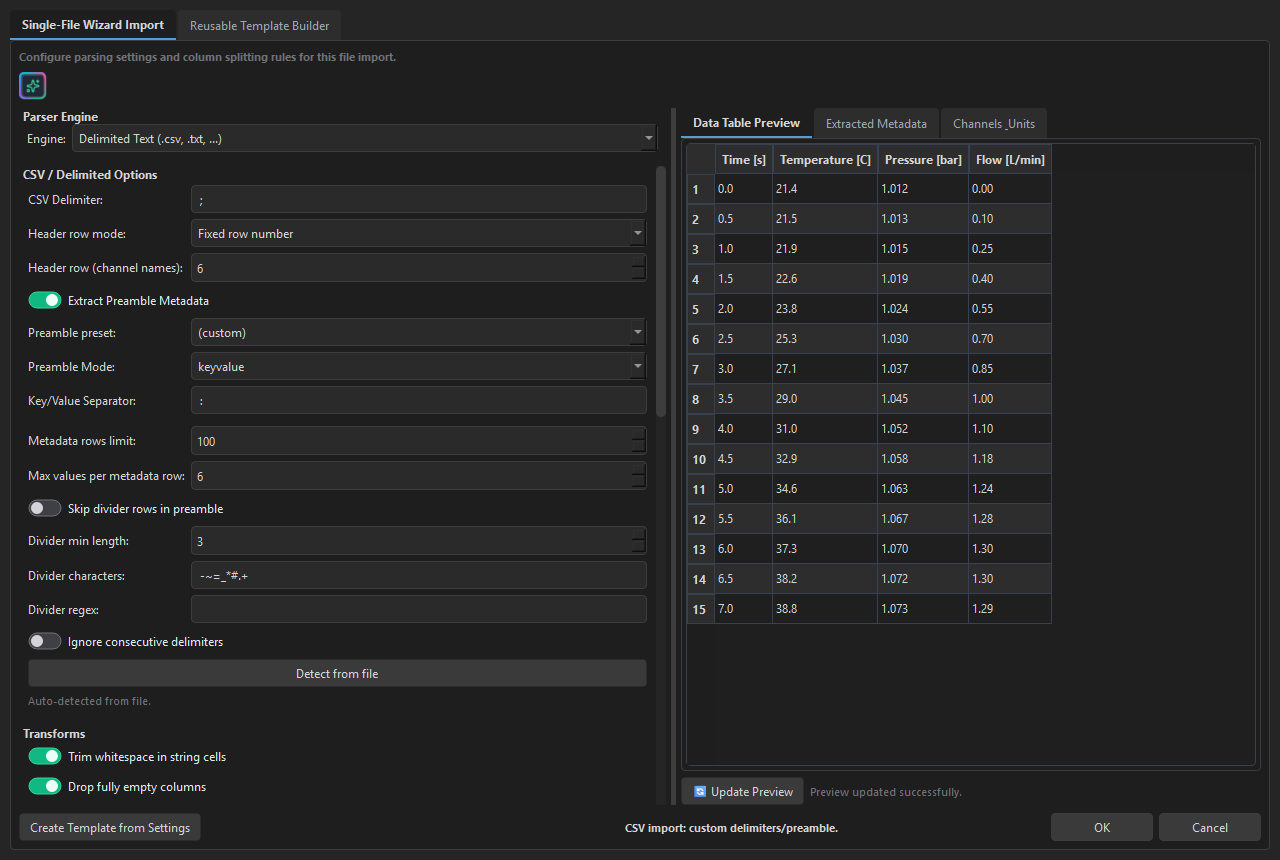
For one-off imports without saving a template, use Tools → Data → Advanced Import Utility - same live preview and preamble detection, applied directly to the selected file.
Open Import Template Builder
Tools → Data → Import Template Builder
Load a sample file
Click Create from File… and select a representative file. The builder pre-fills all settings based on the current file config.
Adjust and preview
The live preview shows how preamble metadata is extracted. Adjust the delimiter, header row, unit detection mode, and channel cleanup rules until the preview looks correct.
Save and apply
Click Save Template. Then apply it per-file, per extension type, or as a global default from the Apply dropdown.
Setting Up AI Chat
Vizalyze's AI chat panel works with any supported provider. Here's how to get started with each option.
Option A - Cloud AI (Claude, GPT, Gemini)
Get an API key
Create an account with your chosen provider (Anthropic, OpenAI, or Google) and generate an API key.
Enter it in settings
Control Settings → AI → Provider. Select your provider and paste the API key. It's stored encrypted in ~/.Vizalyze/app_settings.json.
Open AI Chat
Click ✦ AI Chat in the top-right of the ribbon. Ask anything about your loaded data.
Option B - Fully local AI (Ollama)
Install Ollama
Download from ollama.ai and run ollama pull llama3 (or any supported model). Ollama starts a local HTTP server on port 11434.
Configure in Vizalyze
Control Settings → AI → Provider → Ollama. Server URL: http://localhost:11434. No API key needed.
Example Files & Demo Datasets
Vizalyze ships with 5 example datasets covering different use cases. Access them from Help → Open Examples Folder.
| Example | What it shows | Files included |
|---|---|---|
| messy_csv_preamble/ | Import Template Builder - semicolon CSV, preamble rows, channel cleanup | thermobench_run.csv, thermobench_template.json + README |
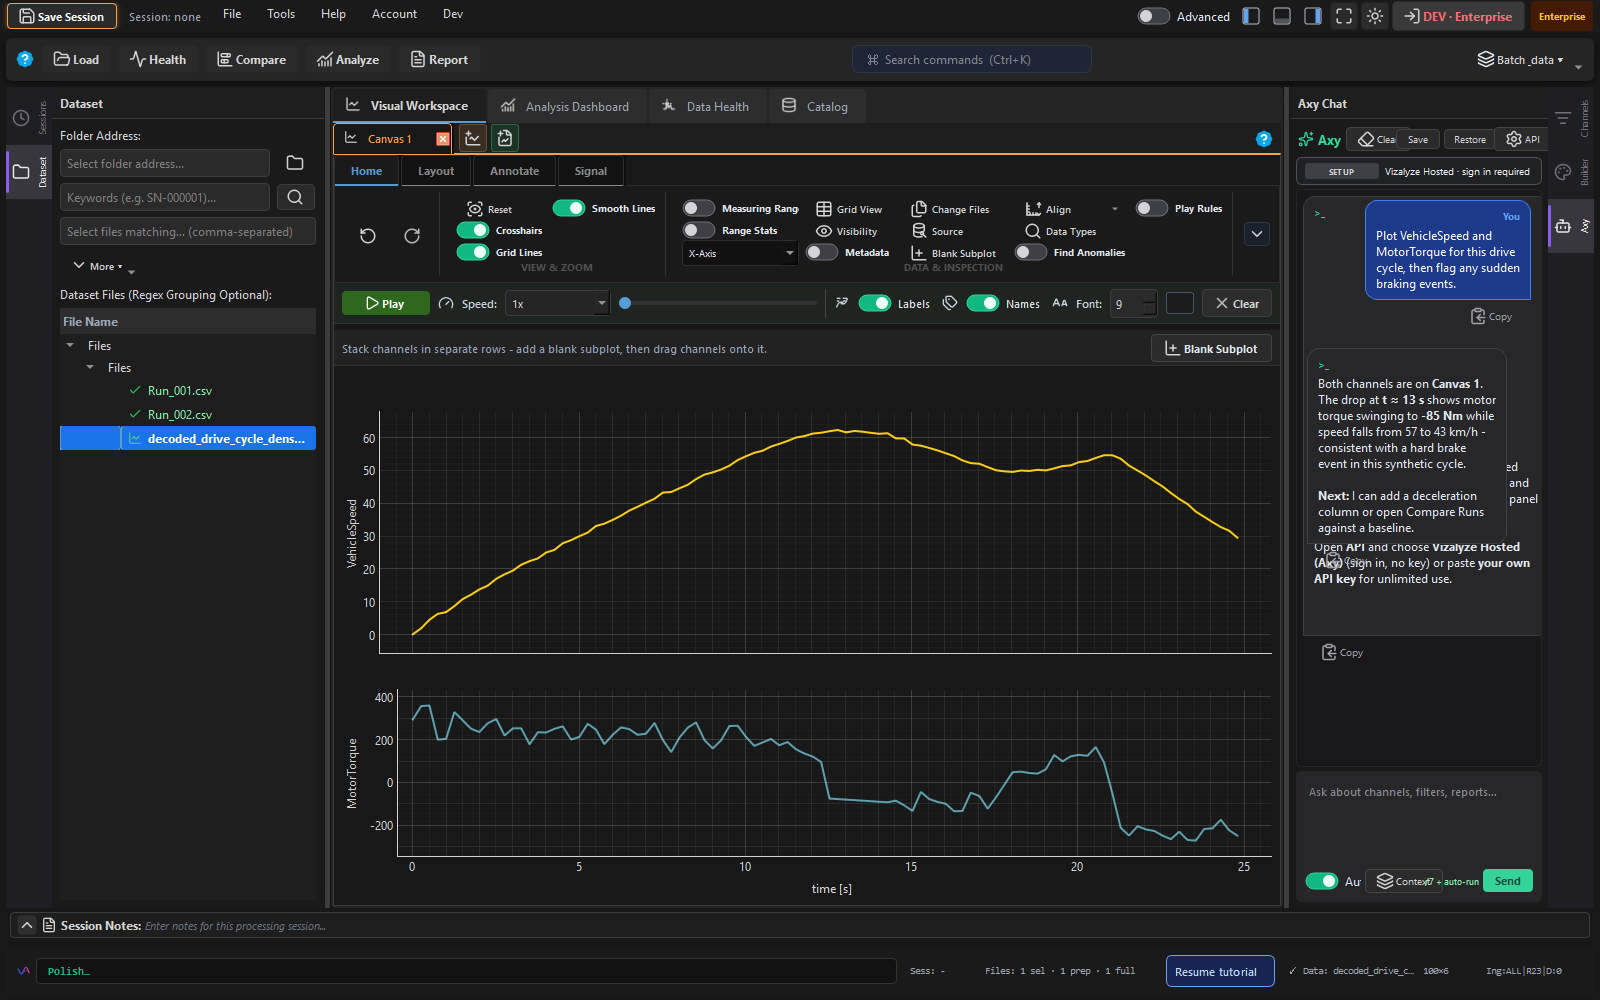
| automotive_can/ | CAN Database Manager + decoded EV drive cycle (no MF4 required for demo) | demo_ev.dbc, decoded_drive_cycle.csv + README |
| pharma_chromatography/ | JCAMP-DX chromatogram loading | demo_chromatogram.jdx, peak_table.csv + README |
| reporting/ | Export PPTX/Word/PDF from a stack test CSV | stack_test.csv + README (templates: *.dpt in repo root) |
| live_monitoring/ | Live file watch + append script for SPC-style demos | live_feed.csv, append_rows.py + README |
Each example folder contains a README.md with a step-by-step walkthrough - typically under 5 minutes to complete.
Keyboard Shortcuts
| Shortcut | Action |
|---|---|
| Ctrl+O | Open file picker |
| Ctrl+S | Save current session |
| Ctrl+, | Open Control Settings |
| Ctrl+Z | Undo last action |
| Ctrl+Y | Redo |
| Ctrl+F | Search metadata catalog |
| Ctrl+E | Export current chart as PNG |
| 1–5 | Jump to workflow step 1–5 |
| F1 | Open Help Center |
| F5 | Refresh / reload active file |
| Scroll | Zoom in/out on chart |
| Middle-drag | Pan chart |
| Right-click chart | Context menu: format series, copy data, export, add alert band |
Frequently Asked Questions
Does Vizalyze send my data anywhere?
No. All file loading and processing runs entirely on your machine. Raw data is never uploaded. If you use cloud AI (Claude/GPT/Gemini), only the prompt context (column names, statistics, your question) is sent - not the raw data. For full local operation, use Ollama or LM Studio.
Do I need an account?
No account is required to analyze data locally - choose “Continue without signing in” on first launch. Sign in when you want to download installers from the website, use encrypted cloud sync, share reports via link, or use org workspace features (Pro/Team).
Can I use Vizalyze in my browser?
Not for full analysis. The desktop app is required for Load, Health, Compare, Analyze, and Report. In a browser you can only view shared report links sent to you, manage your account, and (Pro+) use the live monitor dashboard on vizalyze.app.
Which Excel formats are supported?
.xlsx, .xlsm, .xltx, .xltm, and legacy .xls are supported. .xlsb (binary Excel) is not currently supported.
Can I open MDF files without a CAN database?
Yes. MDF files load fine without a database - you'll see the raw channel names as stored in the file (often cryptic IDs like MSG_0x1A4_Byte0). Assign a DBC/ARXML database to get decoded physical signal names.
What happens if a file is too large?
Vizalyze uses Polars lazy loading - only the first 2,000 rows are loaded for the preview. The full file loads on demand and is cached as Parquet for near-instant re-opens. Very large files (>500M rows) are handled via streaming collection.
Can I run Vizalyze headless / in CI?
Yes. Set QT_QPA_PLATFORM=offscreen and the app runs without a display. The automation server feature (Control Settings → AI Automation Server) exposes a localhost API for script-based automation.
My CSV has header metadata before the data - what do I do?
Use the Import Template Builder (Tools → Data → Import Template Builder) to configure preamble parsing. Choose the mode that matches your file format (key-value, delimited, regex, or raw skip N rows), then save the template so it applies automatically to all files of that type.
How do I get help?
Press F1 to open the in-app Help Center (77,000 words of searchable documentation). For bugs and feature requests, use the feedback form at vizalyze.app.