🔬 Local-first · Privacy-preserving · AI-powered · Multilingual

Professional test data analysis.
Your data stays with you.

A desktop app for measurement analysis - load 31+ formats, compare runs, process signals, batch-report, and ask Axy about your data locally. The interface supports English, German, French, Brazilian Portuguese, Simplified Chinese, Italian, Spanish, Korean, and Japanese, with global and per-file regional decimal/date settings. The website handles downloads, accounts, and optional cloud sharing - not in-browser analysis.

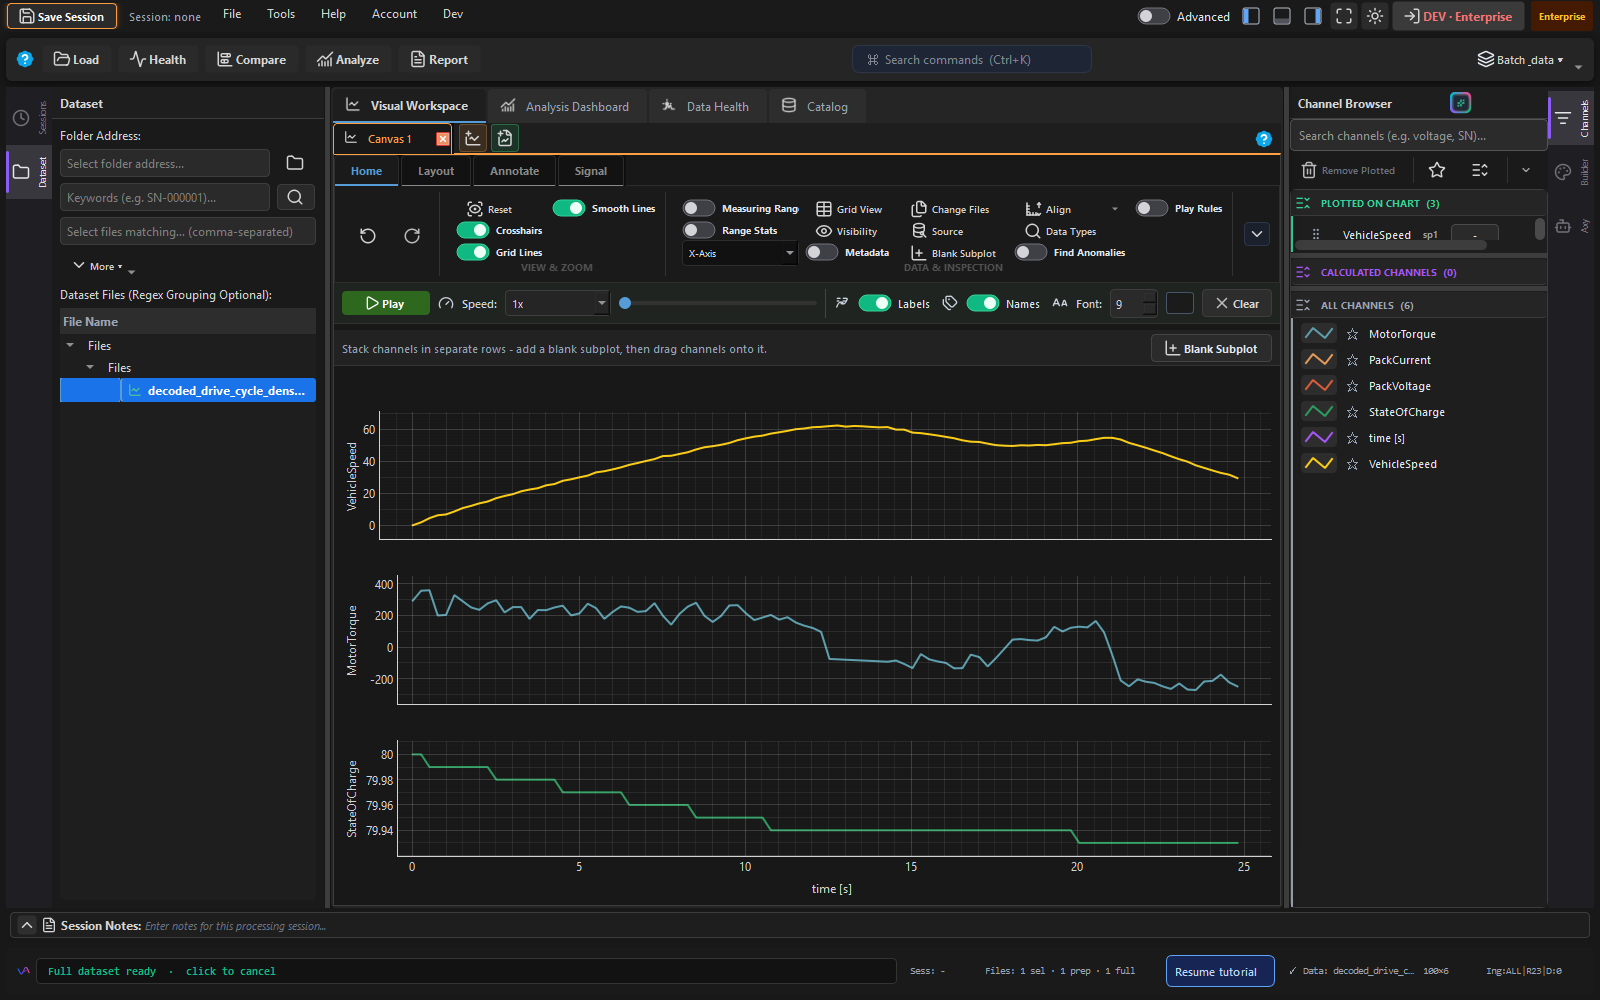
Vizalyze showing drive cycle analysis with VehicleSpeed, MotorTorque, and StateOfCharge plotted over time

See Vizalyze in action

A 2-minute walkthrough covering 31+ formats, AI queries, FFT analysis, run comparison, and batch reporting - all running locally on your machine.

Open full-screen demo

Replaces expensive enterprise tools at a fraction of the cost

NI DIAdem ($3–6k/seat) · AVL Concerto (enterprise seat) · MATLAB ($150+/mo) · Vector CANalyzer (€15k+/seat) · LabVIEW DIAdem
31+
File formats supported
16
Interactive chart types
100+
Signal processing functions
8
Domain analysis profiles
1M+
Points rendered instantly
Free
Forever for local use

Who uses Vizalyze?

Vizalyze is built for anyone who works with measurement, test, or lab data and needs real engineering tools - not spreadsheets.

🚗

Automotive & EV Engineers

Decode CAN/LIN bus data from MDF/MF4 files. Use 6 built-in EV signal presets for speed, torque, battery SOC, temperature, and drive cycles. Supports DBC, ARXML, KCD, SYM databases.

🔋

Battery & Fuel Cell Researchers

Domain-specific KPIs for fuel cell stacks, battery characterisation, and thermal analysis. Ships with FCT stack report templates and battery/thermal analysis profiles.

🧪

Pharma & Lab Scientists

Native support for AIA/ANDI CDF chromatography, mzML mass spectrometry, JCAMP-DX spectra, Thermo RAW, and Sciex WIFF. Integrated with ISO 17025-style metadata reporting.

📊

Test & Data Engineers

Batch-process folders of CSV/TDMS/HDF5 files. Run automated pipelines (health → compare → limits → analyze → report). Export PPTX/Word/PDF from templates in one click.

From raw data to polished report in 5 steps

Every project follows the same guided flow. Click a step in the ribbon to jump directly - Vizalyze keeps everything in sync.

1

Load

Import 31+ file formats with smart preamble parsing, CAN decoding, custom import templates, and locale-aware decimal/date parsing. Preview before loading. Parquet cache for instant re-open.

2

Health

Automatic data quality check. Detects missing data, constant channels, timestamp conflicts. Pass / Warn / Fail badges with recommended fixes.

3

Compare

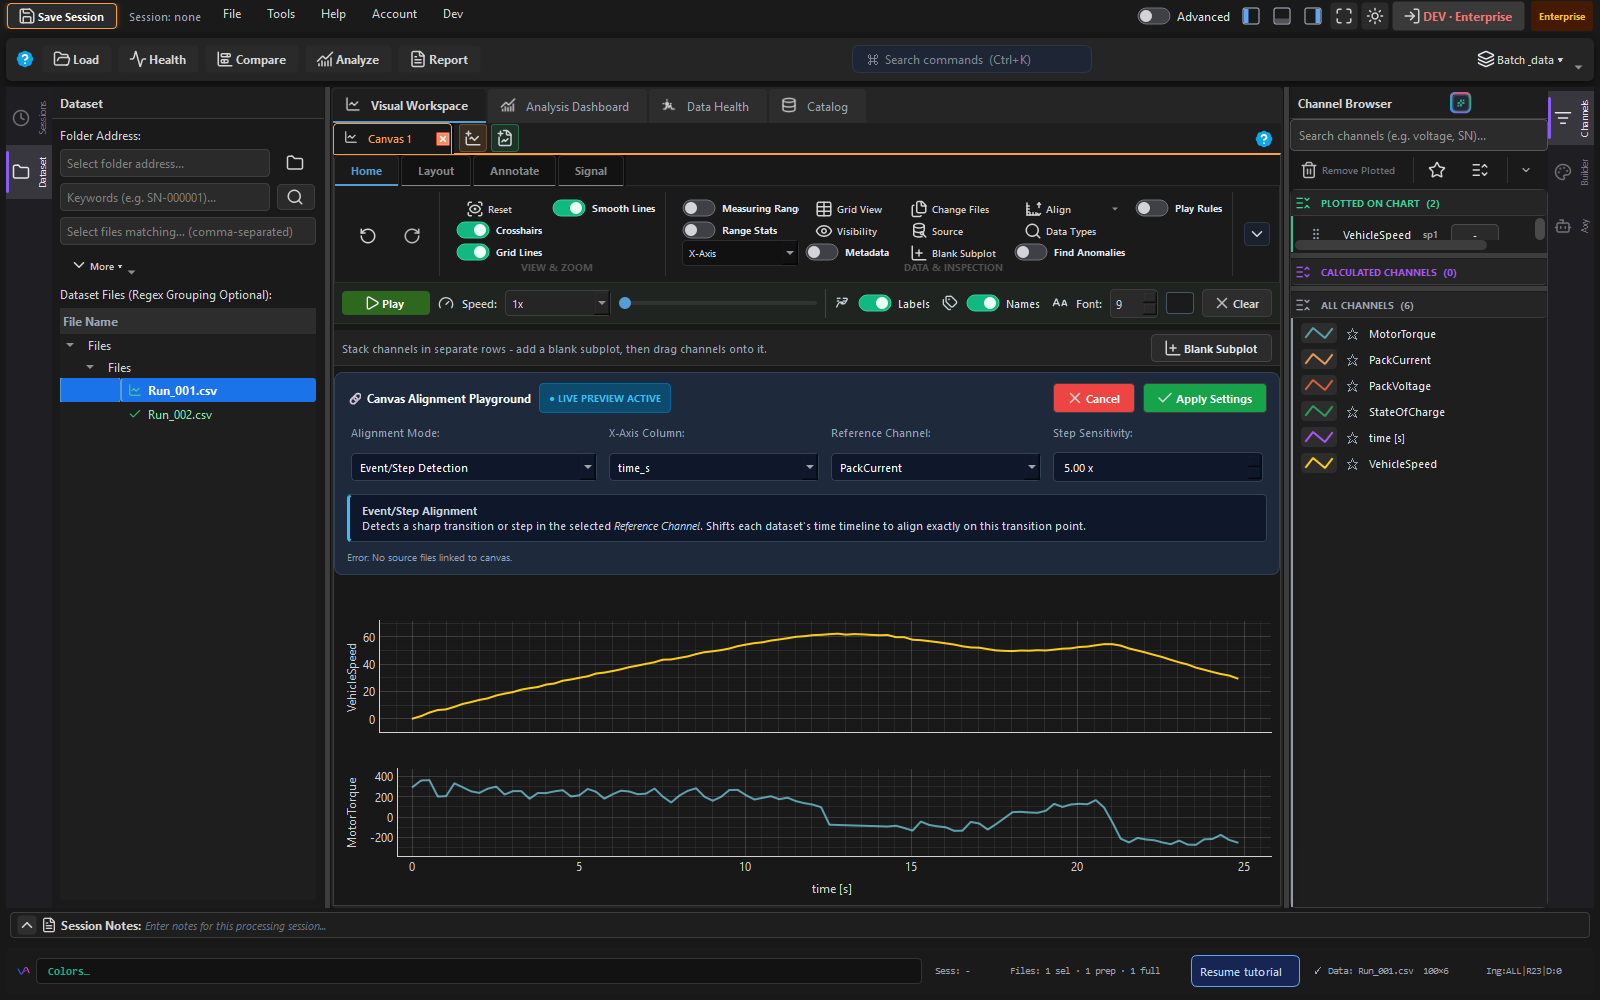
Overlay multiple runs with 6 alignment modes: time column, uniform resample, event-based, setpoint crossing, trend t=0, or row index. Delta tables and lineage tracking.

4

Analyze

Statistics, correlations, unit consistency, limit evaluation, and domain-specific KPIs. 8 domain profiles including fuel cell, battery, pharma HPLC, and vehicle emissions.

5

Report

Batch export to PPTX, Word, and PDF from reusable templates. Auto-summary merges Health + Compare findings. Pipeline recipes save the full workflow for reuse.

Compare Runs panel showing two overlaid drive cycles aligned on a common time axis

16 interactive chart types

From time-series to 3D surface maps, every chart is interactive with hover, zoom, cursors, and per-series styling. LTTB downsampling renders 1M+ points in milliseconds.

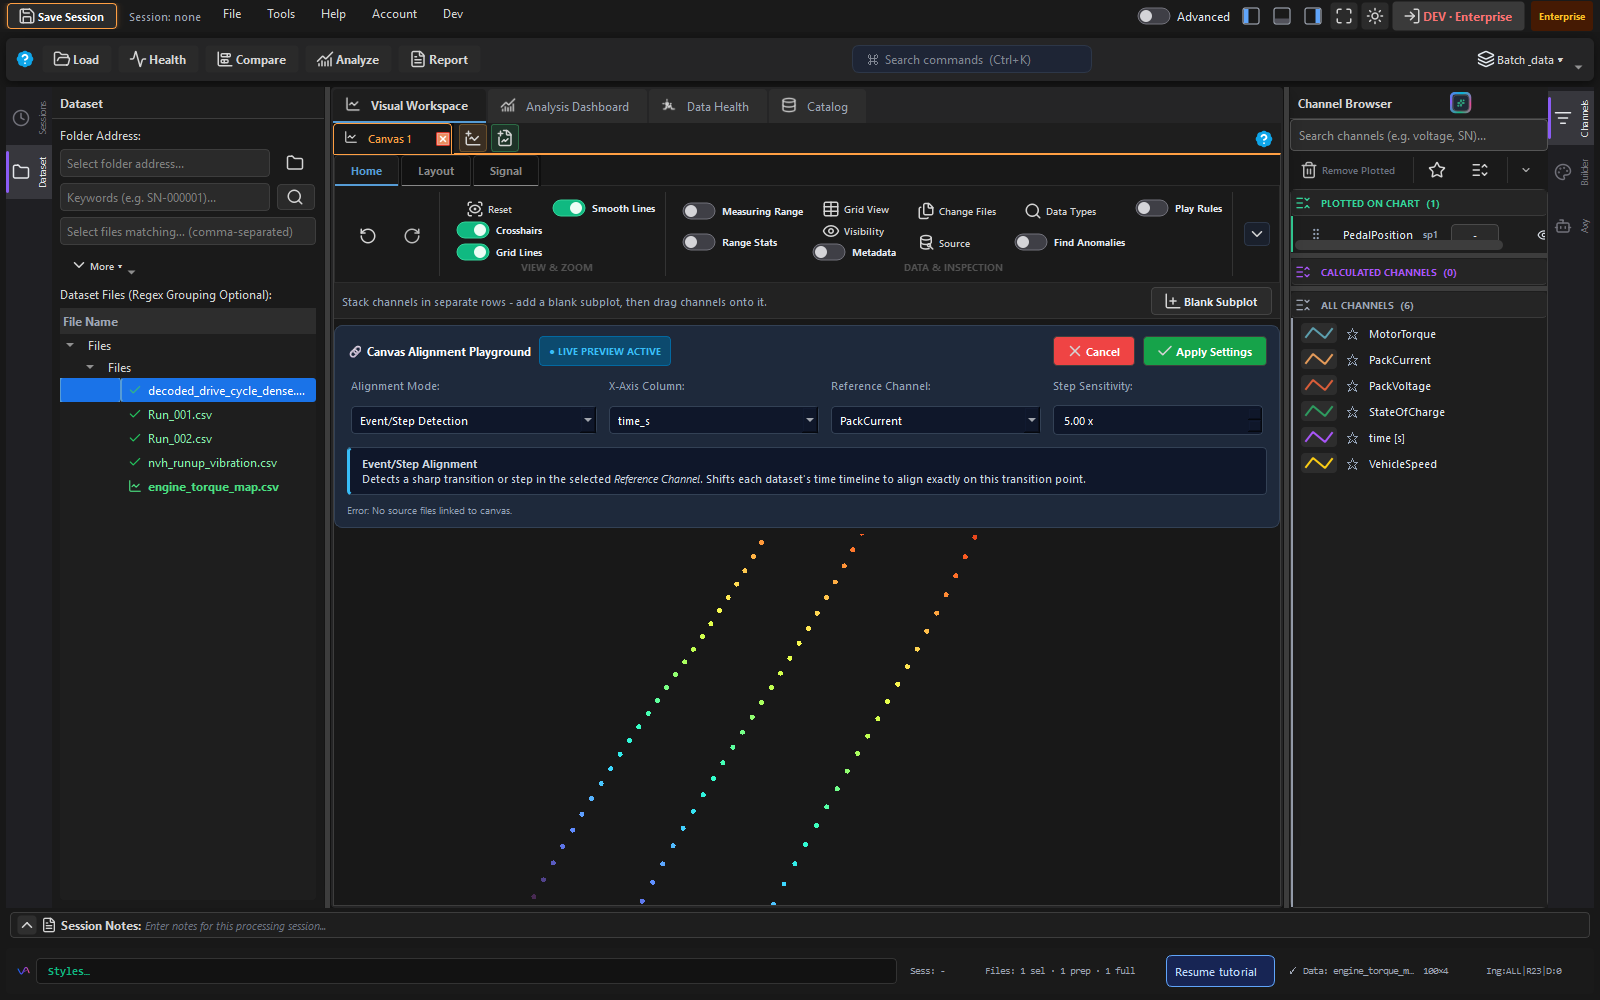
3D engine torque operating map with turbo colormap over RPM and pedal position
3D Scatter & Surface Maps - operating maps with viridis/turbo colormaps and interactive 3D camera.
View all chart options →

31+ formats: free core + 5 extension packs

Core formats (CSV, Excel, PDF) ship with every install. Five specialist packs unlock automotive, lab, scientific, big-data, and pharma formats - purchase individually or included with Team. Content-based detection auto-identifies vendor formats even with non-standard extensions.

Free · Core
📄 Text & Spreadsheet
Always included, no license needed
.csv.tsv.txt .dat.xlsx.xls .xlsm.xltx.pdf
Extension Pack
🚗 Automotive & EV
ASAM MDF/MF4 plus CAN/LIN decoding with DBC databases
.mdf.mf4.mf3 .mf2.atfx
Extension Pack
🔬 Lab & Instruments
NI LabVIEW / TestStand + electrochemistry workstations
.tdms.lvm .dta.ism.isc
Extension Pack
🧬 Scientific & Simulation
MATLAB, HDF5, NetCDF
.mat.h5.hdf5 .nc.nc4.netcdf
Extension Pack
🗄️ Big Data & Analytics
Analytics-optimised columnar formats
.parquet.feather .sqlite.sqlite3
Extension Pack
💊 Pharma & Analytical Chemistry
Chromatography, mass spec, spectra
.cdf.mzml.jdx .dx.raw.wiff
Full format compatibility matrix →

Import, lineage, units & workflows

Advanced import for messy lab exports, immutable provenance tracking, engineering unit conversion, and reusable analysis pipelines.

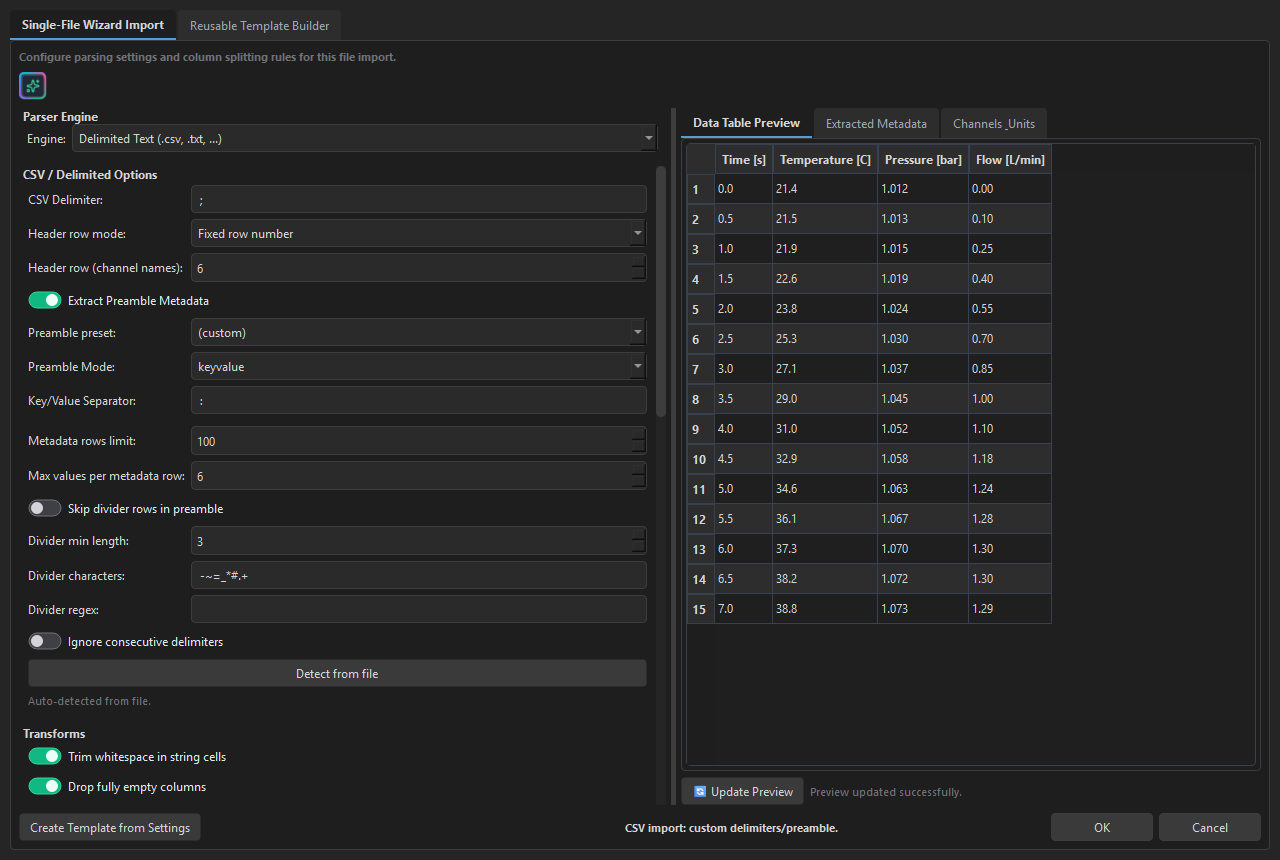
Advanced Import Utility configuring preamble and header detection for ThermoBench CSV
Advanced Import Utility
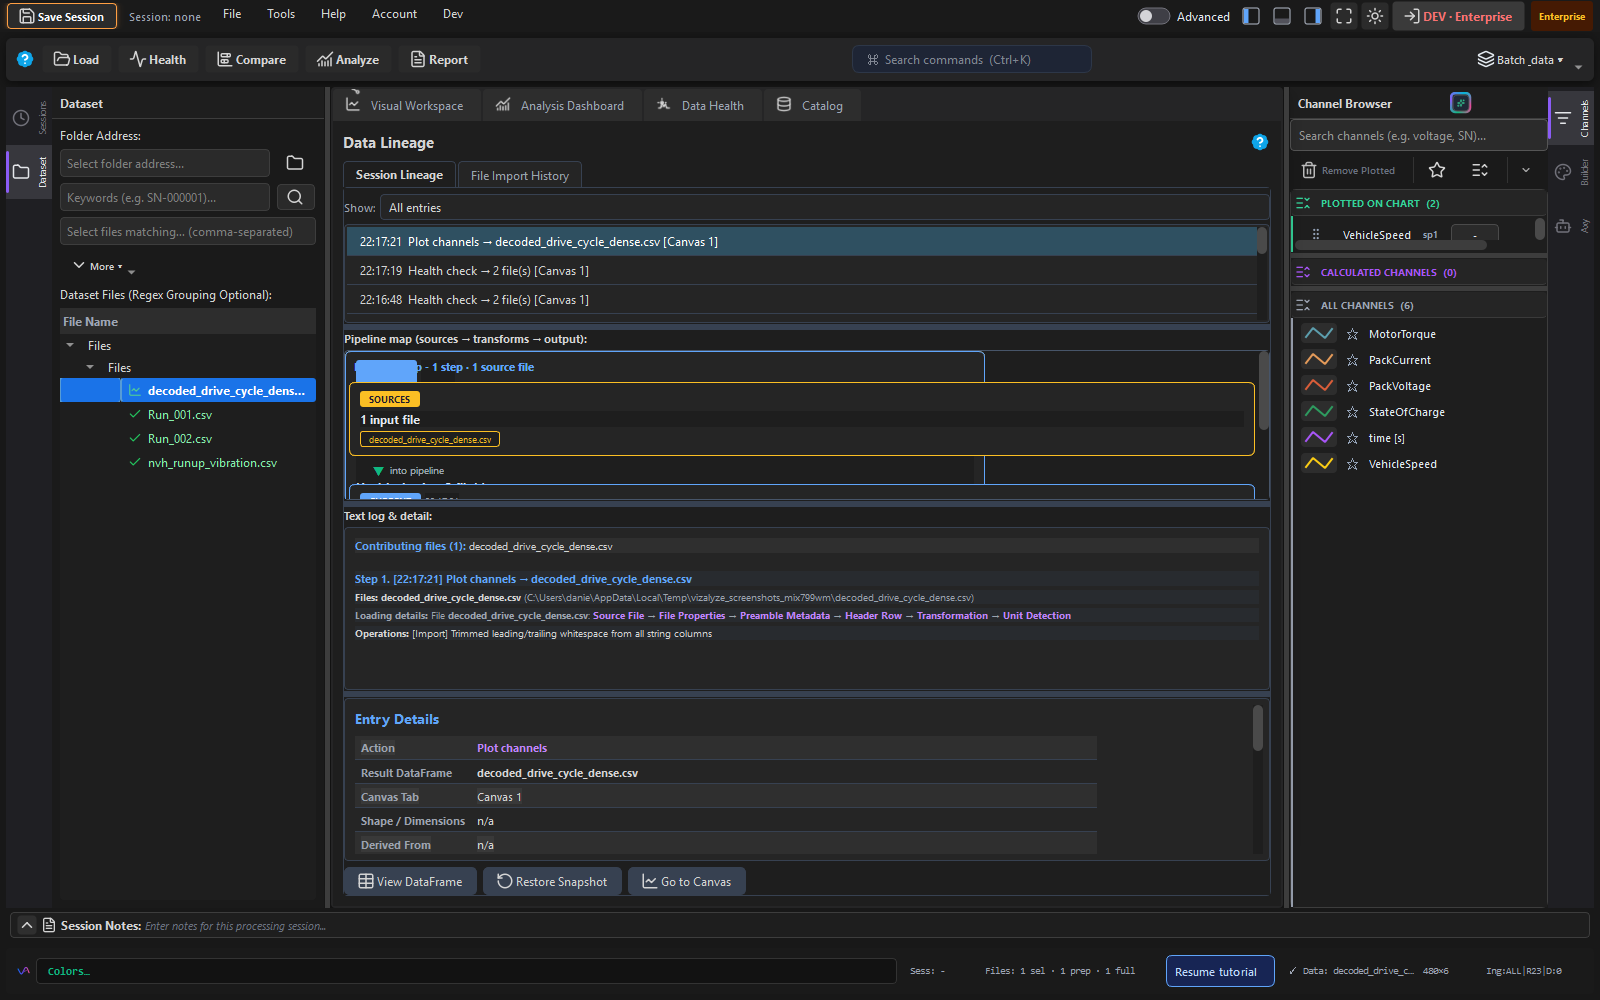
Data Lineage panel showing transformation DAG and ancestry chain
Data Lineage & Provenance
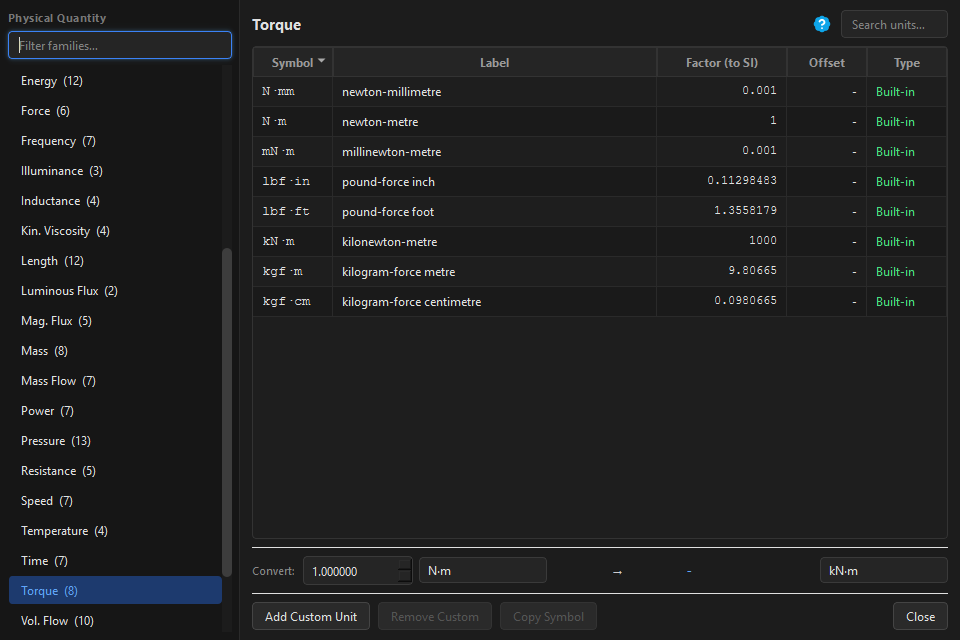
Engineering Unit Library with torque family and inline converter
Unit Conversion Library
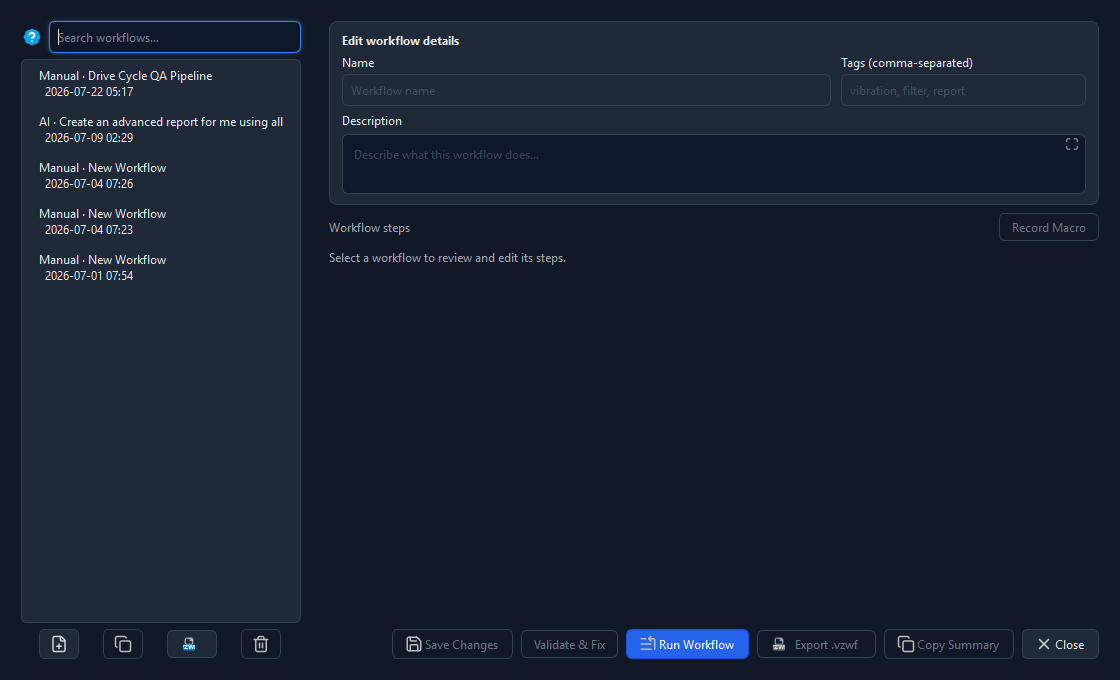
Saved workflow library with drive cycle QA pipeline steps
Workflow Library

100+ built-in transforms

Apply professional signal processing directly inside the app - no Python console needed. Every result is a new computed column with full lineage tracking.

📈

Frequency Analysis

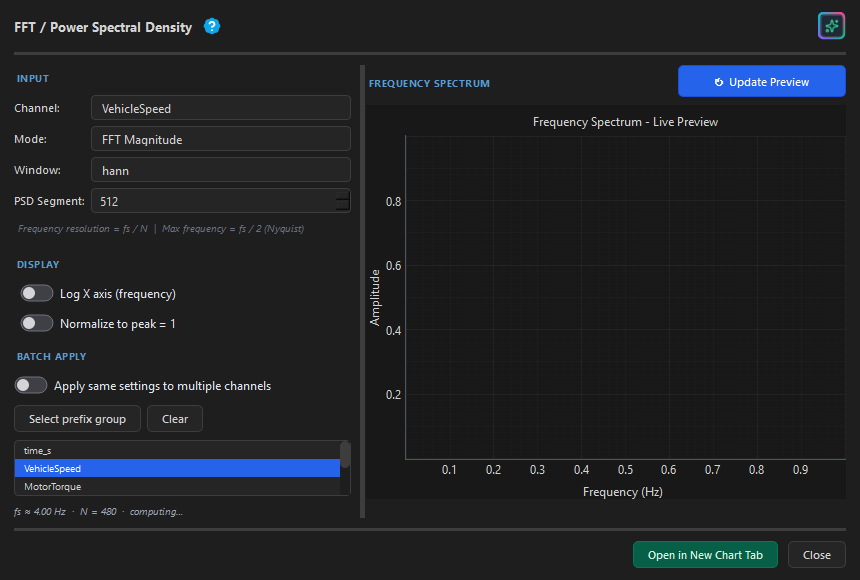
FFT with Hann/Hamming/Blackman windowing · Power Spectral Density (Welch) · Spectrogram (STFT) with log-scaled power

🎛️

Digital Filtering

Butterworth, Chebyshev I/II, Bessel, Elliptic · Low/High/Band-pass, Band-stop · Zero-phase forward-backward filtering

〰️

Smoothing & Resampling

Moving average · Median filter · Savitzky-Golay · Interpolation to uniform time grid

🔍

Event Detection

Peak detection · Anomaly / outlier flagging · Step detection & signal segmentation

FFT frequency analysis dialog showing a power spectrum with dominant peaks
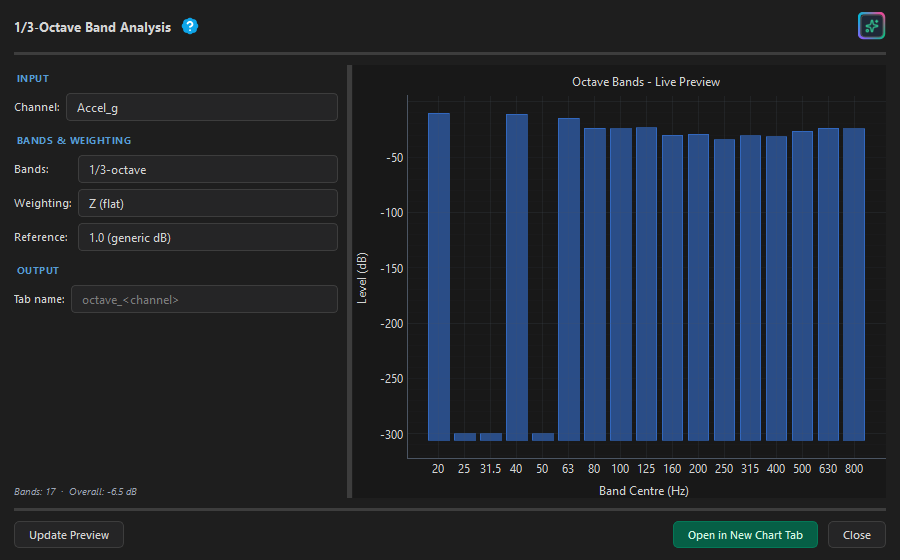
1/3-octave band NVH analysis dialog
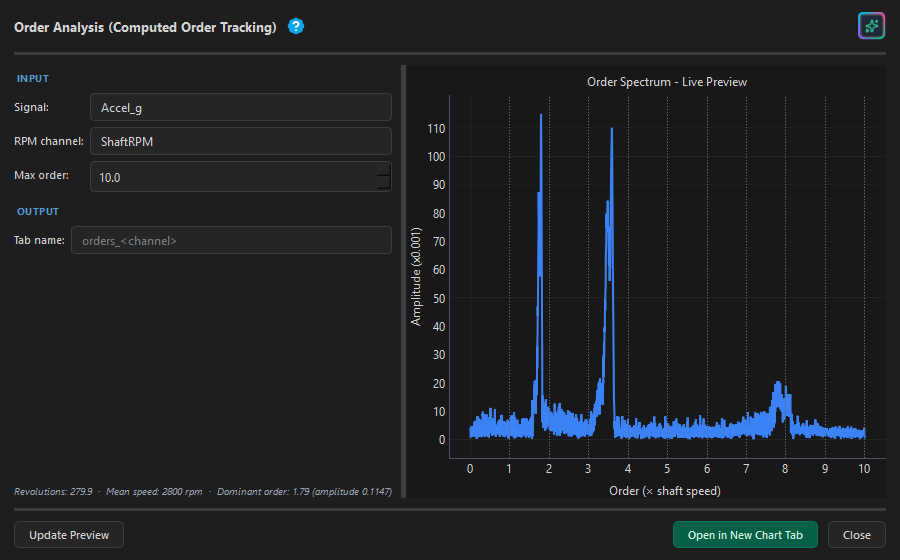
Order analysis spectrum during RPM run-up
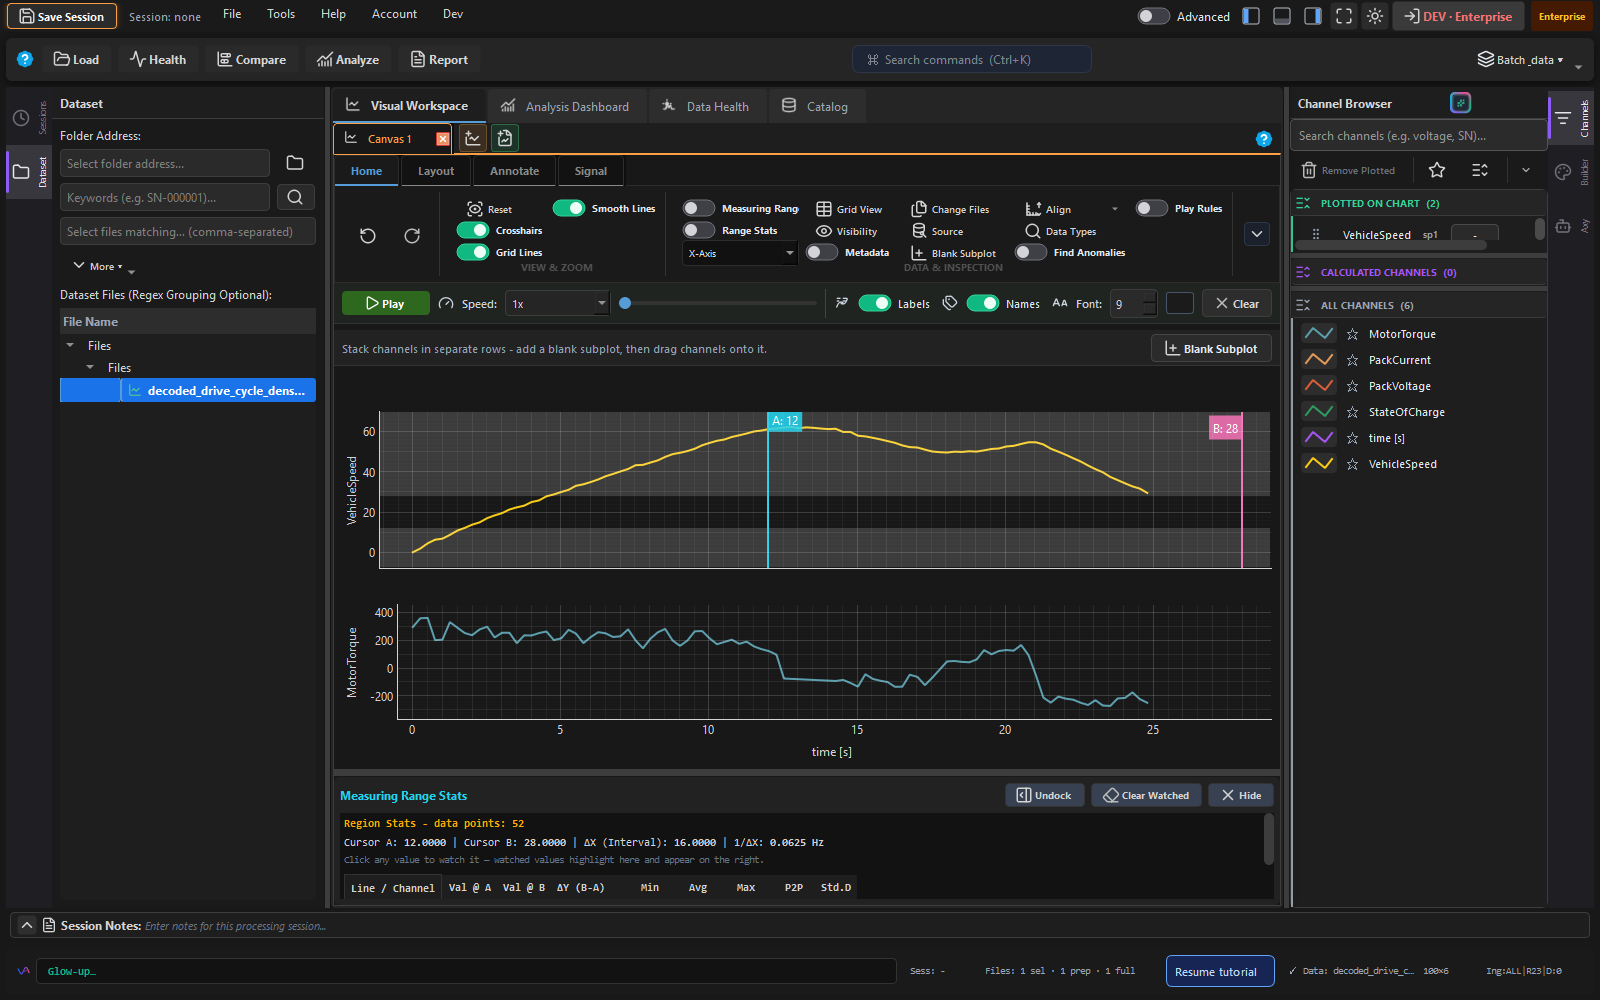
Inspect tool with A/B cursors on a drive cycle

Ask anything about your data

Vizalyze has a built-in AI chat panel that understands your loaded data. Bring your own API key or use local models - your data never leaves your machine.

💬

Natural language queries

Ask "which channel has the highest variance?" or "generate a low-pass filter at 5 Hz" - the AI reads your actual column names and values.

AI-assisted code panel

Write computed column formulas or filter conditions in plain English. AI autocompletes channel names, suggests Polars expressions, and explains errors inline.

🎨

Chart styling & automation

Ask the AI to apply colors, set Y-axis limits, highlight anomaly regions, or generate a full batch report recipe - then save it for reuse.

Bring your own API key for any provider:

Claude (Anthropic)
GPT-4 (OpenAI)
Gemini (Google)
Ollama (local)
LM Studio (local)
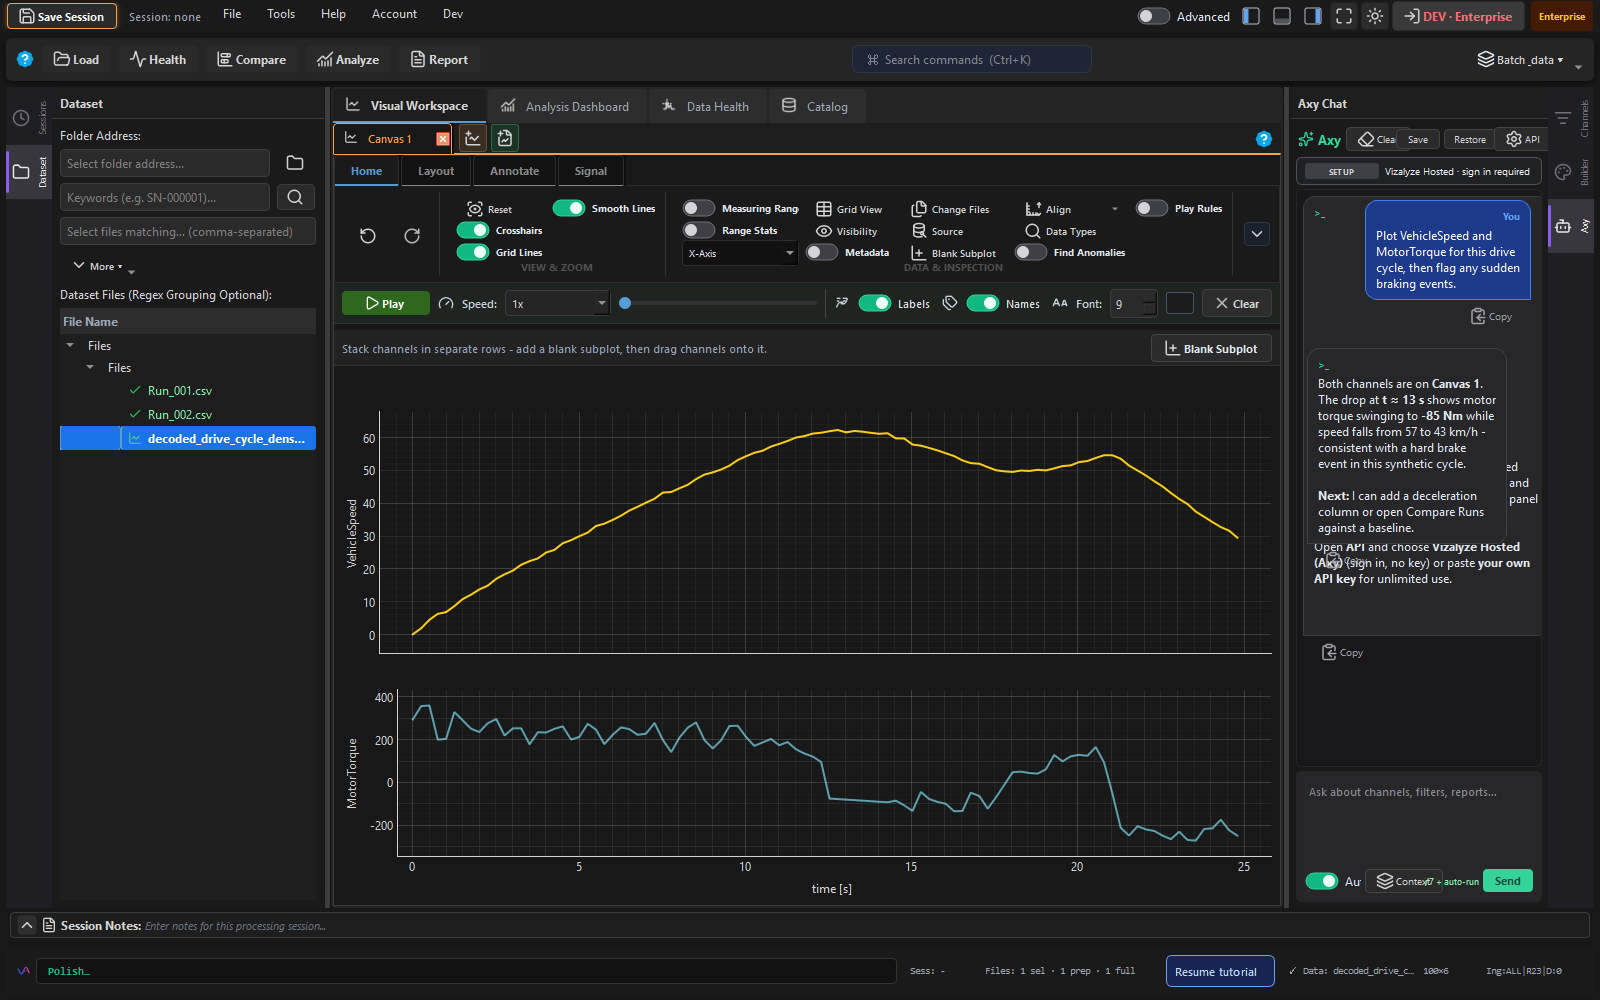
Axy AI chat panel with contextual analysis of loaded drive cycle data
Axy reads your loaded channels and suggests next analysis steps - data never leaves your machine.
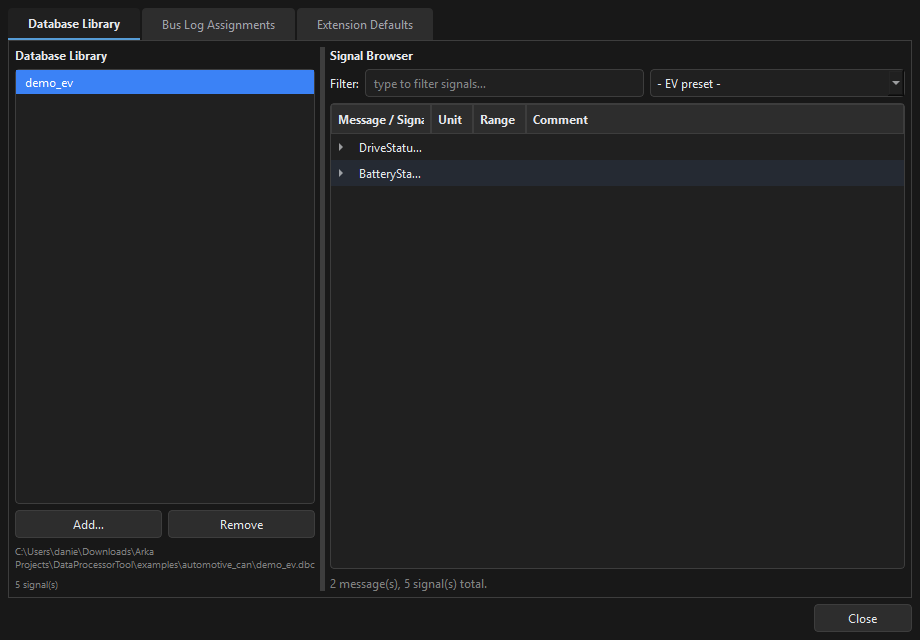
CAN Database Manager showing DBC file browser with EV signal presets

Native CAN/LIN bus decoding

Load MDF/MF4 files from data loggers and decode CAN/LIN bus signals automatically using your DBC, ARXML, KCD, or SYM database files.

🗃️

CAN Database Manager

Maintain a persistent library of database files. Browse message/signal trees with IDs, units, min/max, and comments. Assign databases per file or globally via import templates.

6 Built-in EV Signal Presets

One-click selection of the most important EV channels: ev_speed, ev_torque, ev_battery, ev_temperature, ev_driver, ev_drive_cycle.

🔄

Automatic Decoding

Physical signal extraction via asammdf bus logging on file load. Supports all MDF versions (MF2, MF3, MF4) and ATFX transfer format.

Batch export to PPTX, Word & PDF

Build reusable report templates with dynamic data, charts, KPI cards, and ISO 17025-style metadata. Batch-process entire folders in one pipeline run.

📊

Report Template Builder

Design layouts with text blocks, tables, charts, KPI cards, dynamic formulas, and computed columns. Save as .dpt files and share across the team. Ships with 3 full fuel-cell templates.

Pipeline DAG

Wire up an executable pipeline: Health → Compare → Limits → Analyze → Report. Steps run in dependency order. Save/load recipes as JSON. Process up to 40 files per batch run.

📋

7 Built-in Presets

Durability, run comparison, sensor drift, step test, limit check, transient, and efficiency report presets. Auto-summary merges Data Health and Compare Runs findings automatically.

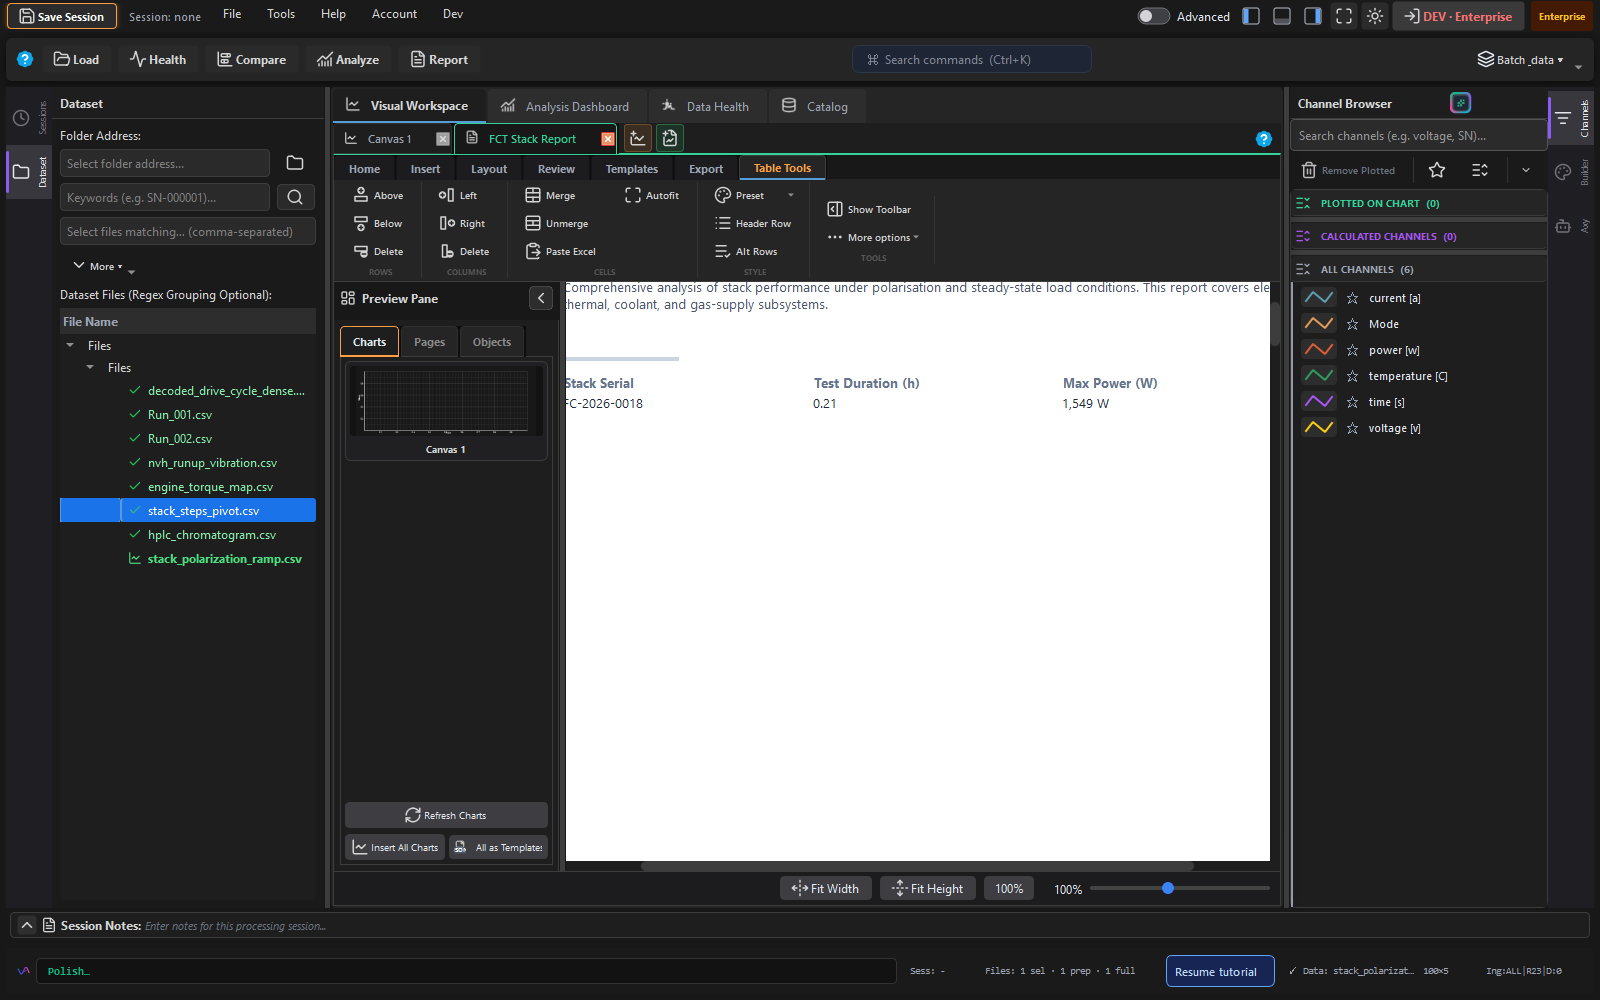
Fuel cell stack qualification report cover with metadata and KPI highlights
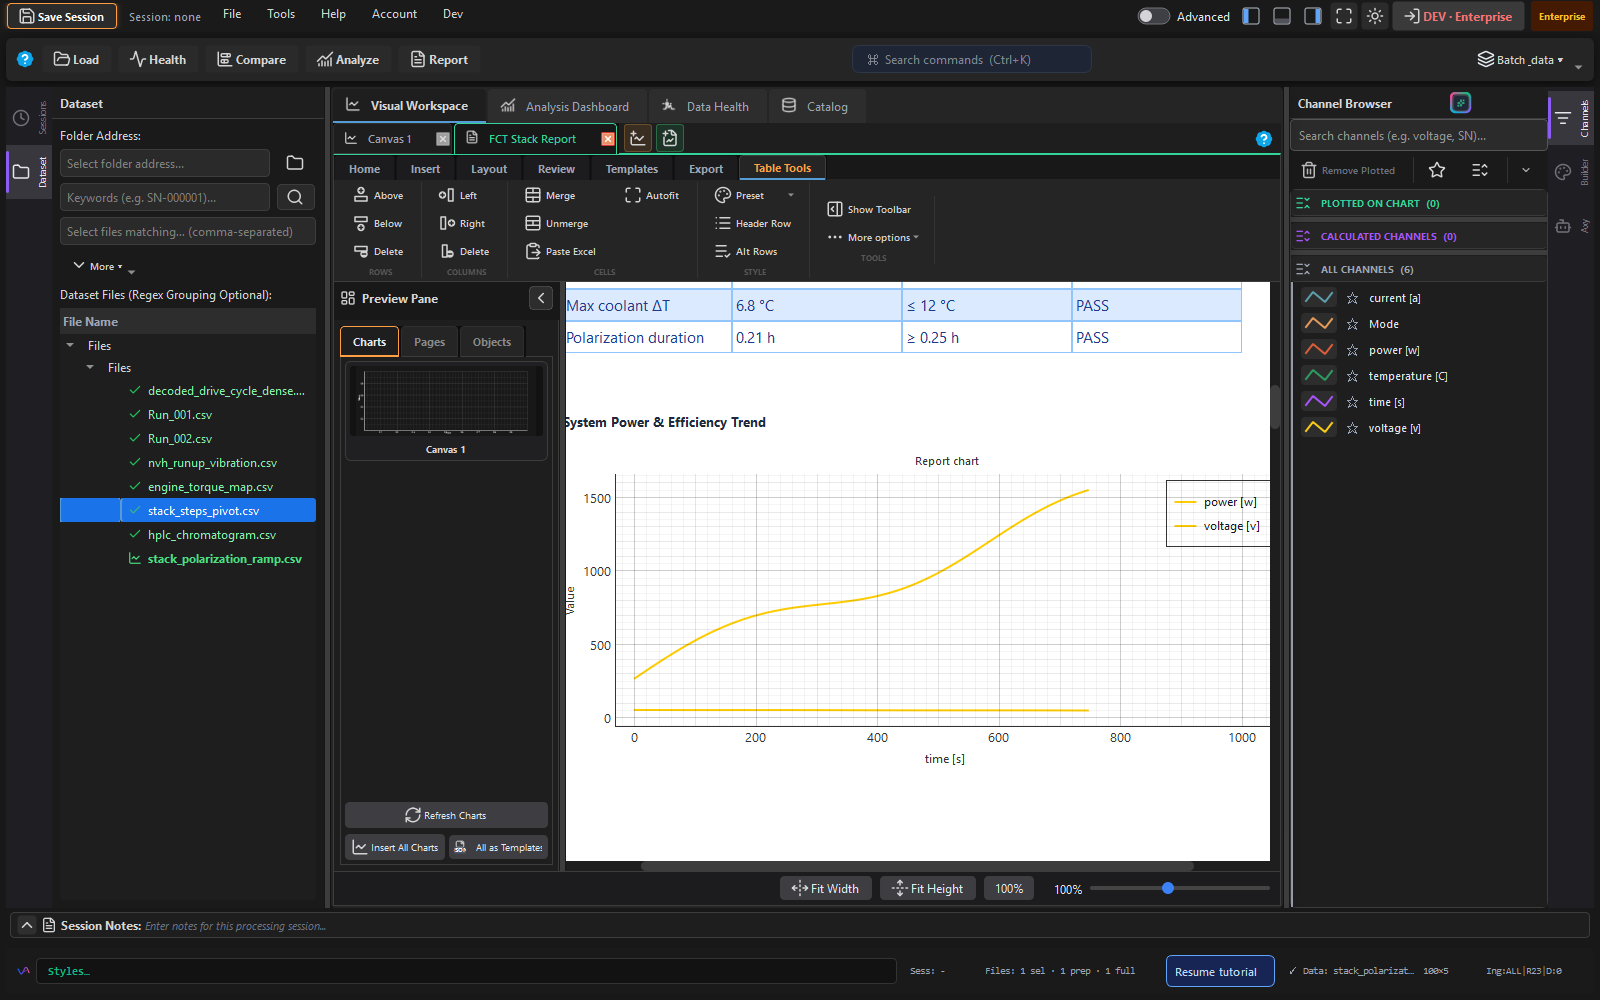
Populated report page with KPI table and electrical performance charts

Local-first. Zero-knowledge cloud sync.

Your raw measurement data stays on your machine. Vizalyze was designed from day one to work fully offline and keep sensitive test data under your control.

💻

Data stays local by default

All file loading, processing, and analysis runs 100% on your machine. Raw data is never uploaded. No telemetry without consent.

🔐

Zero-knowledge encrypted cloud sync (Pro+)

Workflows, sessions, and templates are encrypted with AES-256-GCM before upload. Your key, always. Even Vizalyze cannot read your synced content.

🤖

Your own AI keys

Bring your own Claude, GPT, or Gemini API key. Or use fully local models via Ollama / LM Studio - no data leaves the device at all.

Free forever for local use

No credit card required. No account needed for core features. Sign in only when you want cloud sync or secure report sharing.

Start free. Scale when you need to.

Every tier includes the full desktop app with local processing. Pro unlocks signal processing, batch reporting, advanced charts, and live monitoring - plus cloud sync and report sharing. Team adds standards-aligned test workflows and shared org libraries.

Free
$0 / forever

Core local analysis - no credit card, no time limit.

  • Core file formats (CSV, TXT, TSV, DAT, Excel, PDF)
  • Basic chart types (line, scatter, bar, area, histogram, step)
  • Data Health panel
  • Compare Runs (all alignment modes)
  • Run bundled example workflows
  • AI chat (bring your own key, or 10 hosted queries/day)
  • Specialist formats via extension packs
  • Signal processing & advanced charts (Pro)
  • Batch reporting (Pro)
  • Cloud sync & secure report sharing (Pro)
Download free
Lifetime
$699 one-time

Pro features forever. No subscription, no renewal.

  • Everything in Pro
  • 2 machine activations
  • All future Pro features
  • No recurring billing
  • Standards-aligned test workflows (Team)
Buy Lifetime →
Team
$89 / seat / mo

Standards-aligned workflows, shared libraries and audit trail for engineering teams.

  • Everything in Pro
  • 18 test standards + ISO 17025-style metadata and traceability fields
  • All 5 extension packs included
  • Org workspace (shared libraries & templates)
  • 50 GB cloud storage
  • 5 machine activations per seat
  • 200 saved sessions · 500 saved workflows
  • Immutable audit log
  • Org management & invites
  • 5 seats minimum
Start Team →
Start analyzing in minutes - free, forever

Download the desktop app for local analysis. Sign in on the website only if you want cloud sync or shared reports.

⬇ Download Vizalyze